Identifying spectral signatures of perceptual categorization in the human cortex
This is a cover story for the research paper by
Ilya Kuzovkin, Juan R. Vidal, Marcela Perrone-Bertlotti, Philippe Kahane, Sylvain Rheims, Jaan Aru, Jean-Philippe Lachaux, Raul Vicente
Identifying task-relevant spectral signatures of perceptual categorization in the human cortex
bioRxiv preprint
Machine learning has become a common tool in neuroscience research. The most prevalent use case is the task of decoding — finding a model that can take neural activity as input and identify which experimental condition was the one that caused that particular neural response. For most applications the resulting machine learning model can be treated as a black box — it answers the research question at hand, while the internal logic of how exactly it arrives to its conclusions is not of importance within the scope of a particular research study. With my work I am trying to convey the message that making the extra step of analyzing the behavior of the model can lead to important insights. This research project is one such example.
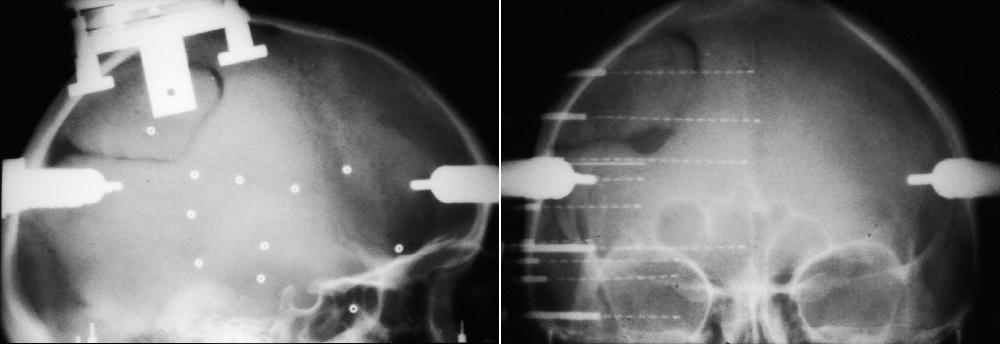
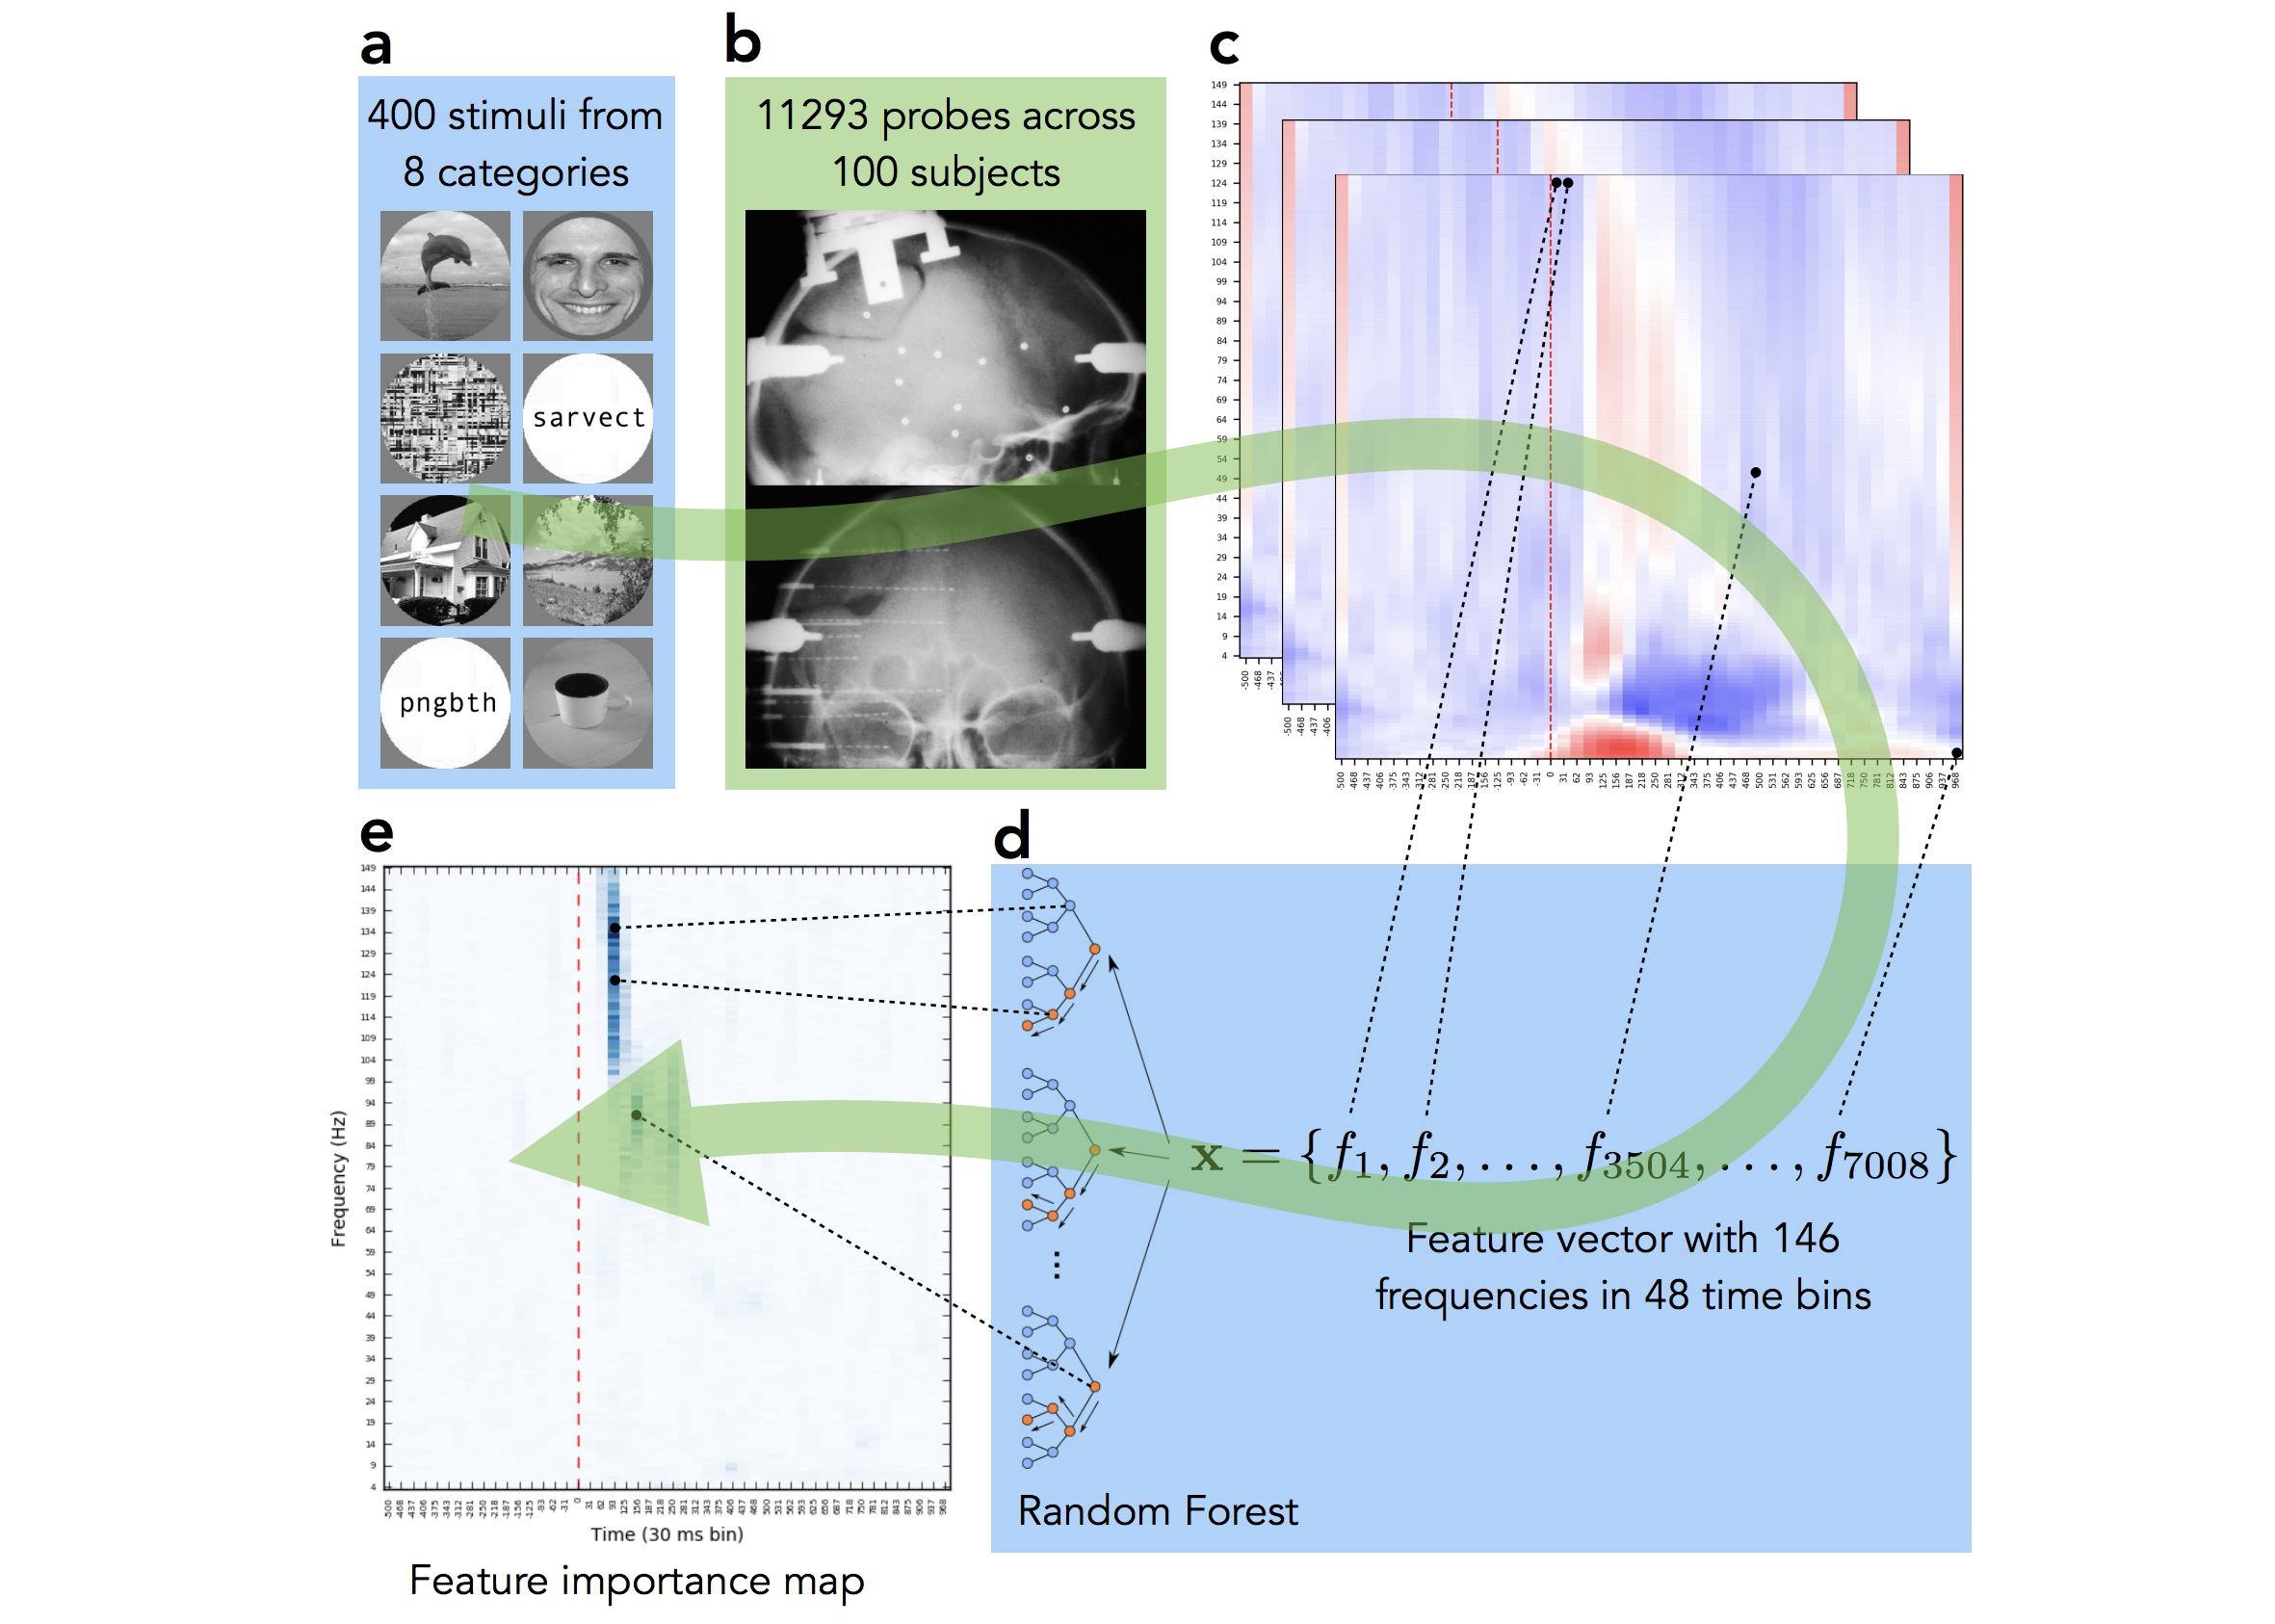
The data for this study comes from Lyon Neuroscience Research Center in France. Patients were implanted with intracerebral microelectrode rods and were asked to look at 400 images from 8 different categories. We then, as many before us in numerous studies on other neural datasets, trained a Random Forest to decode the category from neural signal. Basically to see how well we can guess from their mental activity which type of image the subject is looking at. However, in this case we were not interested in the performance of the decoding, given the quality of the data we were confident that it would be high (and it was, 90%+ accuracy), but rather we wanted to see which parts of the neural signal the machine learning model will rely on when making decision. Which parts of the signal are the most informative for the task of visual decoding? Do they differ across categories? The pipeline of our approach is visualized on Fig 2.
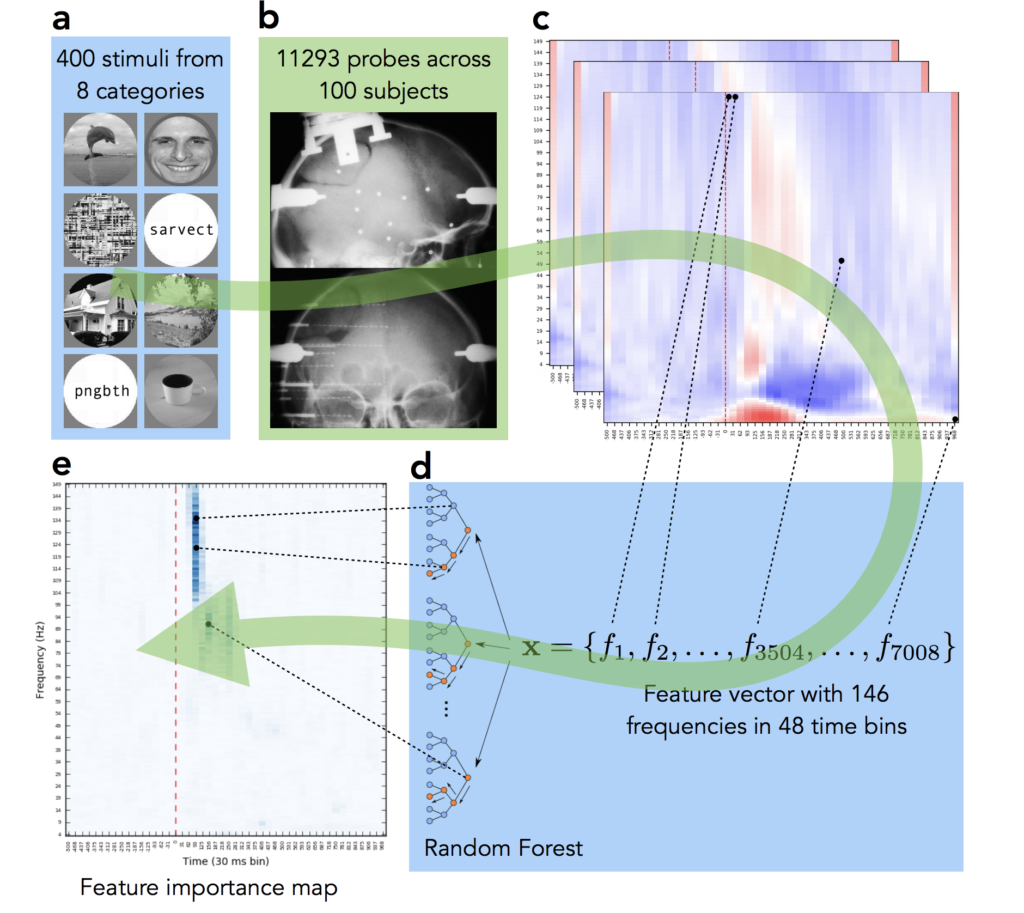
The final panel Fig 2e shows where in time-frequency domain the important activity was. Compare it to the activity map on panel Fig 2c — we can see that while multiple frequency bands were active across time, the important information of this particular electrode’s activity was located at early high gamma frequency band. We repeated this analysis under for all 12,000+ implantation sites, for all categories and analyzed the results. While mainstream neuroscience is hypothesis-driven, our results demonstrate the need and applicability of data-driven method.
Result A. We have found that among responsive electrodes (activity changes significantly after stimulus onset) only 5% are predictive (can distinguish between two or more visual categories), see Fig 3. This approach allows us to understand which neural locations are relevant to the task of visual decoding of focus on those.
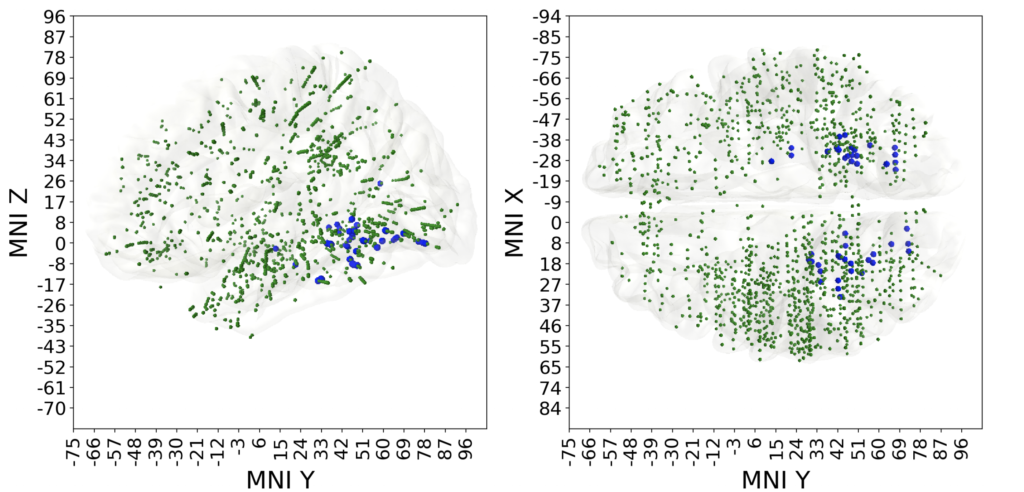
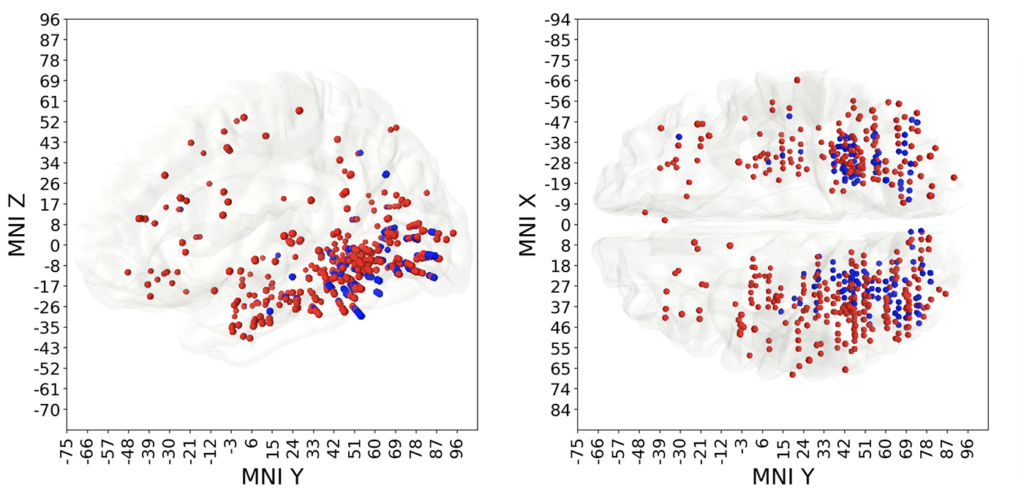
Result B. Some of electrodes were predictive of multiple different visual categories, those polypredictive electrodes were located predominantly in the visual cortex. Other electrodes were predictive of only one category, in other words were narrowly specialized. Monopredictive electrodes extended well beyond visual cortex into temporal, parietal and prefrontal lobes. Blue markers on Fig 4 indicate polypredictive locations, while the red ones mark the monopredictive, specialized, locations.
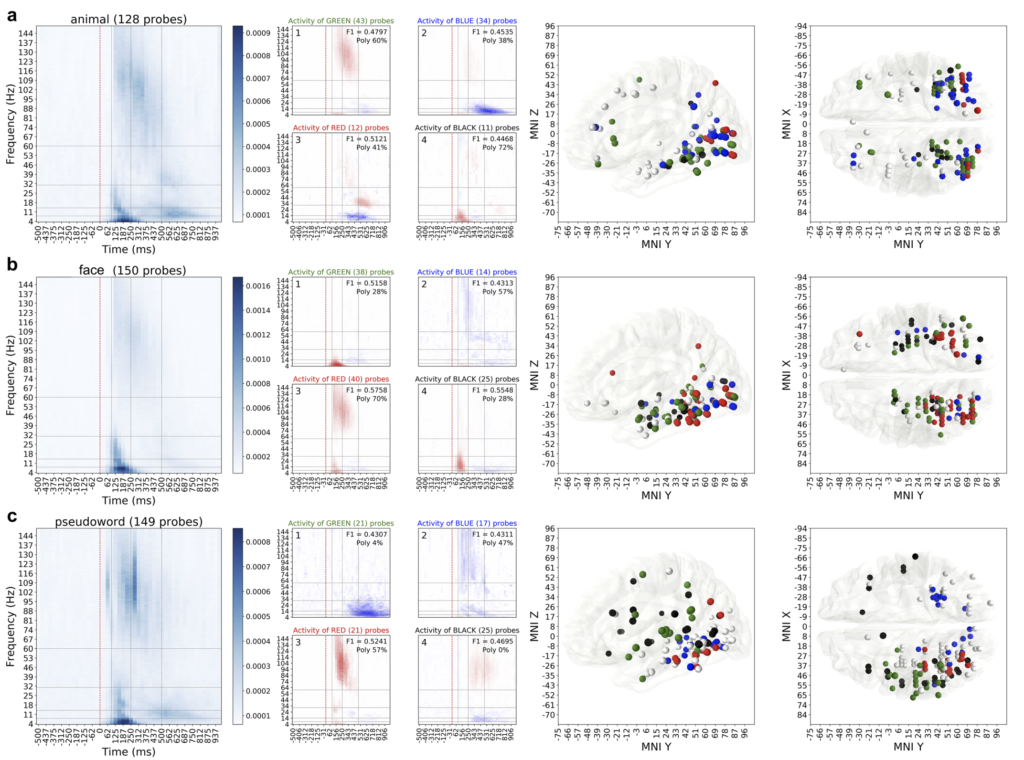
Result C. Different categories had different and specific patterns of spectrotemporal activity associated with them (Fig 5). We ran an extensive clustering analysis to group neural location into clusters based on their activity. When visualized those clusters revealed consistencies in anatomical locations of those electrodes, suggesting the relation between the brain areas and their functional role in perceptual categorization of natural images.
For more details, results and analysis please see the original publication.
BioRxiv preprint: Identifying task-relevant spectral signatures of perceptual categorization in the human cortex
Code of the analysis on GitHub: https://github.com/kuz/Spectral-signatures-of-perceptual-categorization-in-human-cortex
Supplementary materials on figshare: https://figshare.com/account/home#/projects/64523
No comments yet.