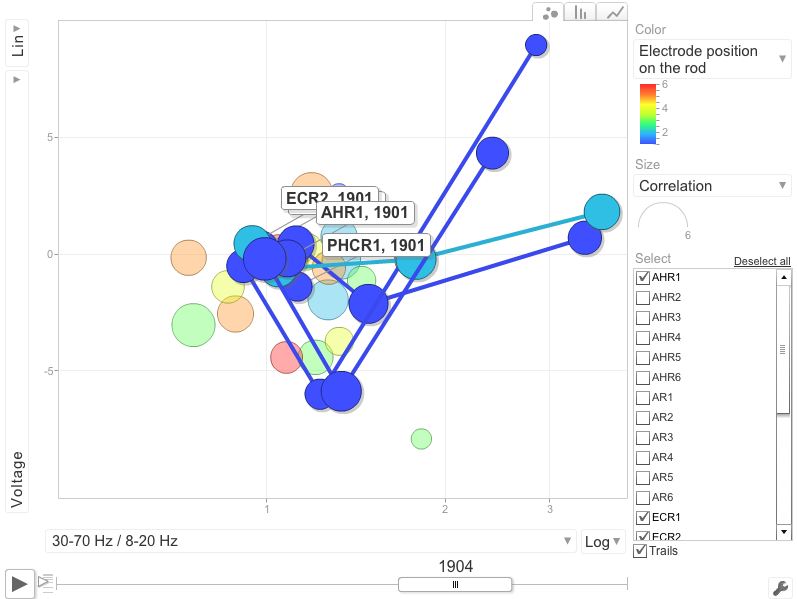
Bubble Chart for EEG Data Visualization
During “Data Mining” course me and Kristjan Korjus have attempted to come up with some new ideas of how EEG data can be visualized. You can see the demo (takes ~10 sec to load) and read the notes
During “Data Mining” course me and Kristjan Korjus have attempted to come up with some new ideas of how EEG data can be visualized. You can see the demo (takes ~10 sec to load) and read the notes
No comments yet.